Fact-checked · September 2, 2026
Living at home isn’t falling behind.
Nearly half of U.S. adults under 30 live with a parent. In a tough housing market, sharing a roof can be a smart runway—not a verdict.

01 · The reality
This is a market story, not a character story.
The Federal Reserve’s newest household survey puts a clean number on what families already feel: 49% of adults under 30 lived with a parent in 2025, up 12 percentage points from 2019.
That headline is true. It also needs context. “Under 30” includes many 18- to 24-year-olds, including students. A separate Census-based analysis found 57.1% of 18- to 24-year-olds and 21.7% of 25- to 29-year-olds lived in a parent’s home in 2023. Both measures matter; they answer different questions.
1985 = 100 · Nominal dollars
Income beat inflation. Home prices outran both.
Picture a 30-year-old in 1985 and one in 2024. Overall prices nearly tripled and median household income more than tripled—but the median price of a newly built home grew to almost five times its 1985 level.
Metric | 2024 index | Change since 1985 |
|---|---|---|
Overall prices | 292 | +192% |
Median household income | 355 | +255% |
Median new-home price | 499 | +399% |
Sources: BLS CPI-U; U.S. Census Bureau household income; Census/HUD median price of new houses sold; Freddie Mac PMMS via FRED. The chart indexes each nominal series to 1985 = 100. New homes changed in size and mix over time, so this is a directional cost comparison—not a complete affordability model.
02 · The ownership ladder
The people buying homes are older.
NAR’s 2025 survey puts the median first-time buyer at 40 and the median repeat buyer at 62. Among repeat buyers, 30% paid all cash. It is a portrait of a market where accumulated equity has become a powerful advantage.
One important caveat: NAR’s annual profile covers successful owner-occupant buyers who closed between July 2024 and June 2025. It is not the same series as monthly mortgage-backed estimates, which can report a higher first-time-buyer share.
The ladder moved later
03 · Why the math changed
Three numbers explain most of it.
Prices
$431,400
National median existing-home price in July 2026, up 2% year over year.
Rates
6.66%
Average 30-year fixed rate on August 27, 2026. It briefly touched 5.98% earlier in the year.
Supply
4.03M
Realtor.com’s estimate of the national housing supply gap in 2025. Other methods produce different estimates.
The original draft’s core argument survived. The sharper version replaces “supply is the only fix” with “supply is the biggest structural lever,” avoids treating forecasts as promises, and drops a future-quarter affordability index and a young-worker claim that could not be matched cleanly to public source language.
04 · Chicagoland
One region. Several different markets.
“Chicago” can mean the 77 city community areas, a nine-county metro, the suburban detached-home market, or the broader federal metro division. Good local analysis labels the geography before quoting the number.
The region is not following the easier-inventory story seen in many Sun Belt metros. Realtor.com counted 14,609 active Chicago-area listings in July, 7% fewer than a year earlier, while the national market gained 2.1%. That tight supply helps explain why local list prices rose even as the national median list price fell.
Home values rose about 61% from Q2 2019 to Q2 2026
The index climbs from 184.0 in 2019 to 296.2 in 2026, with the steepest gains in 2022 and 2024. Full values are in the table below the chart. 180 220 260 300 2019 2021 2023 2025 184.0 296.2
View the index values
Q2 | Index (1995 Q1 = 100) |
|---|---|
2019 | 184.01 |
2020 | 188.49 |
2021 | 203.60 |
2022 | 233.89 |
2023 | 243.10 |
2024 | 262.07 |
2025 | 278.91 |
2026 | 296.21 |
The county changes the entry point
Waiting for a crash is not a plan. Building options is.
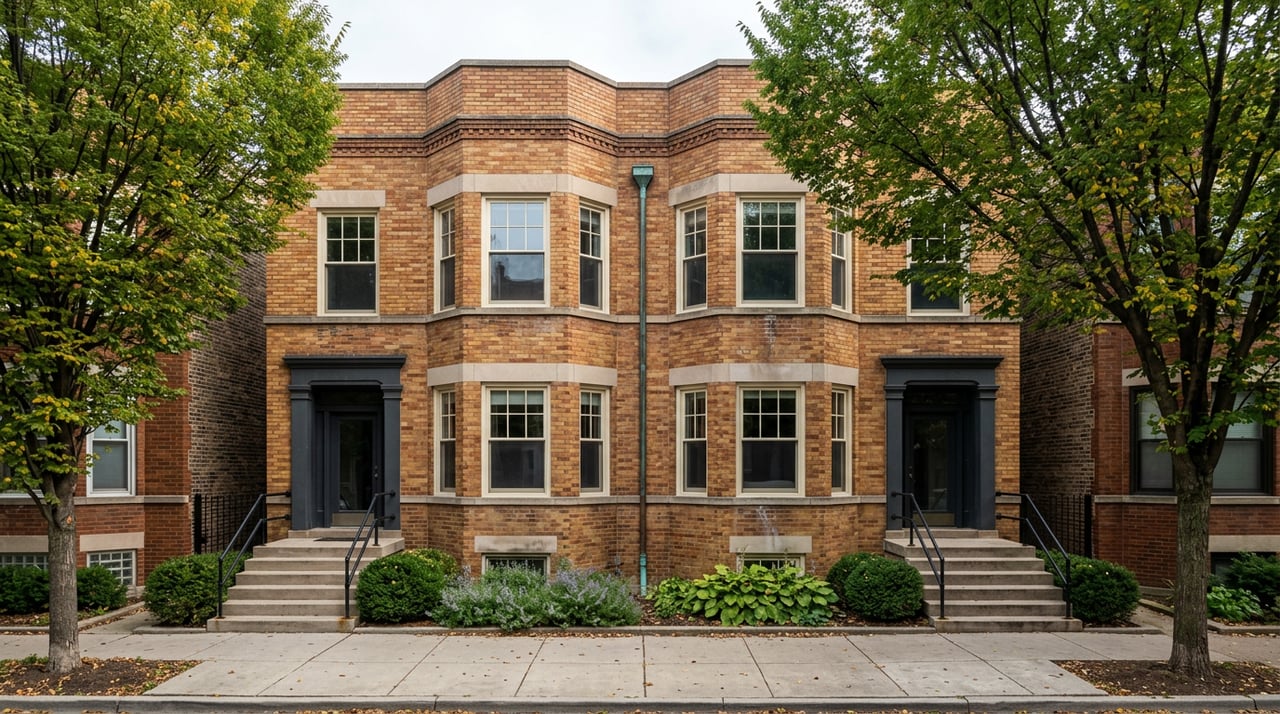
Chicagoland’s constrained inventory gives sellers leverage, but the region still offers a wider range of price points than a single headline suggests. A condo, townhome, two-flat or a different county can change the math more than a small move in mortgage rates.
Turn “living at home” into a date on the calendar.
This quick planner is intentionally simple. It shows how shared housing can become momentum when the monthly savings are automatic and the goal is visible.
14% 14%
Down payment only. Closing costs, reserves, taxes, insurance and eligibility are separate.
05 · Run the strategy well
Make the time at home do a job.
- Put a number and a date on it
“Saving for a house” is a mood. “$35,000 by March 2028” is a plan. Automate the transfer on payday.
- Agree on the household deal
Name the contribution, chores, privacy and timeline. A good arrangement protects both generations.
- Make credit boring
Pay on time, keep revolving balances low, avoid new debt before applying and review all three reports for errors.
- Talk to a housing counselor or lender early
Ask what is holding back approval: income, debt-to-income ratio, credit, cash or property type.
- Search by monthly cost, not just price
Include taxes, insurance, association dues and maintenance. In Chicagoland, property taxes can reshape the comparison.
- Widen the shape of “starter home”
Condos, townhomes, two-flats and transit-connected suburbs can be a foothold without being a forever home.
The best version is a runway with guardrails.
Pew found 64% of young adults living with a parent said the arrangement helped their finances. Among parents sharing a home with a young adult child, 74% said it had a positive impact on their relationship.
The caution belongs beside the optimism: Thrivent’s 2026 survey found 47% of current boomerang parents said some part of their own finances was affected, and 76% of boomerang kids said their parents had not explained the long-term impact. The answer is not guilt. It is a clear conversation.
A pause can still be progress.
Living with a parent is not automatically strategic, and it is not available—or healthy—for everyone. But when it is workable, a shared roof can buy something rare in this market: time. Give that time a purpose, protect the family relationship, and measure forward motion in savings, skills and options—not somebody else’s timeline.
Sources
- Federal Reserve SHEDfederalreserve.gov/publications/2026-economic-well-being-of-us-households-in-2025-living-arrangements-care-work.htm
- BGSU National Center for Family & Marriage Researchbgsu.edu/ncfmr/resources/data/family-profiles/loo-young-adults-in-the-parental-home-2007-2023-fp-24-02
- U.S. Bureau of Labor Statistics CPIbls.gov/regions/mid-atlantic/data/consumerpriceindexhistorical_us_table.htm
- U.S. Census Bureau, 1985 incomecensus.gov/library/publications/1987/demo/p60-156.html
- U.S. Census Bureau, 2024 incomecensus.gov/library/publications/2025/demo/p60-286.html
- Census/HUD annual new-home prices via FREDfred.stlouisfed.org/series/MSPNHSUSA
- Freddie Mac mortgage rates via FREDfred.stlouisfed.org/series/MORTGAGE30US
- NAR 2025 Profilenar.realtor/press-releases/first-time-home-buyer-share-falls-to-historic-low-of-21-median-age-rises-to-40
- Freddie Mac PMMSfreddiemac.com/pmms
- FHFA Chicago house-price index via FREDfred.stlouisfed.org/series/ATNHPIUS16984Q
- Illinois REALTORS® market dataillinoisrealtors.org/marketstats/about-market-stats/
- Realtor.com July 2026 market trendsrealtor.com/research/july-2026-data/
- IHDA homebuyer programsihda.org/lenders-realtors/lending-programs/
- Pew Research Centerpewresearch.org/social-trends/2024/01/25/parents-young-adult-children-and-the-transition-to-adulthood/
- Thrivent boomerang kids surveyprnewswire.com/news-releases/economic-pressure-makes-boomerang-living-a-new-normal-annual-thrivent-survey-finds-302755068.html
Survey results can vary because age ranges, definitions and methods vary. Mortgage rates are national averages, not personal quotes. The calculator is educational and is not lending, tax, legal or financial advice. Assistance programs and eligibility can change; verify terms with the program administrator.